TA data tab
This topic describes the TA data tab on the Data view, which by default is located at the bottom of the ESPA analysis center screen.
This feature requires option E7 Advanced CDRs. If you do not have this option, or have not uploaded a CDR file with TA (Timing Advance) data then this tab is not displayed.
The TA data tab displays all the TA data for sources you selected and retrieved by clicking Refresh or Refresh data.
By default the data is listed in date/time order with the earliest data listed first.
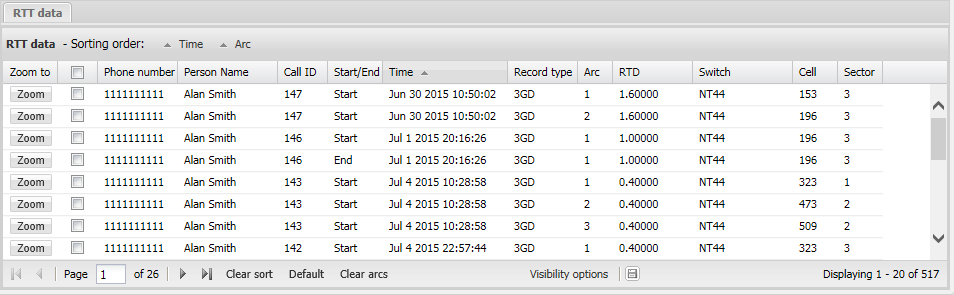
You can select to display different types of TA data on this tab as shown in the graphic below.
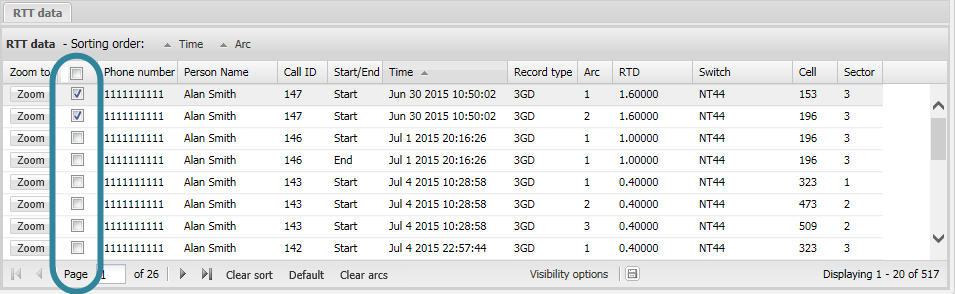
By default the ESPA analysis center's map does not display any of the TA arcs. However the column immediately beside the Zoom to column allows you to select which TA arcs you want displayed on the map. Note, selecting or deselecting the check box in the column header applies only to the current page of results.
You can also select, by clicking Visibility options, to show only the records based on your selection on either the CDR data tab or the Timeline tab. For further information refer to TA data display options dialog box.
Use Clear arcs to deselect all the check boxes and therefore remove all the TA arcs from showing on the map. Note, even if you have filters applied to the TA data tab the Clear arcs applies to all records and not just the filtered records.
Click  to export a .csv file of the TA data displayed on the TA data tab. This .csv file contains all the information that is available on the TA data tab, including any columns that are not displayed.
For further information on using the zooming, filtering, grouping and sorting features refer to Using basic features of the data view.
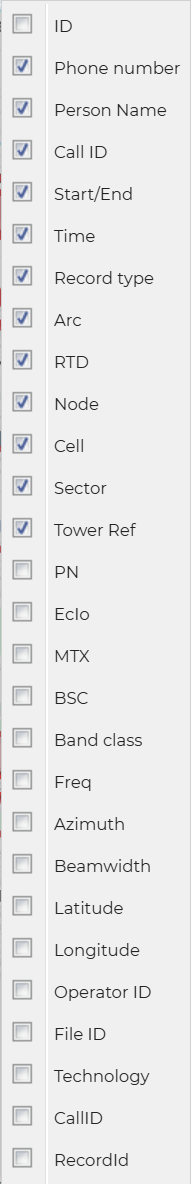
If you have previously changed the tab's: column visibility settings, column order, column filters, sorting, and grouping then these are saved for the next time you open the ESPA analysis center screen. To restore them to their default condition click Default.